
These days, we’ve got more online content to interact with than ever before — and not nearly enough time to see, read, and watch it all. So let’s be honest — what would you rather do, spend an hour reading a boring wall of text on a Facebook post, or take a quick look at a snappy, short, and visually stunning infographic that gives you the gist of all the important information?
In most cases, people choose the latter. Today, more than 70% of all marketing content contains some sort of visuals — and studies show that it improves engagement rates far more than written information.
The reason for that is fairly obvious — today, the average attention span of an Internet user is a measly eight seconds. Yep, quite literally lower than an actual goldfish. That means you’ve got a very narrow timeframe to catch the eye of your target audience — and visually attractive content is how you’ll do it.
On the other hand, creating visual content is a big issue for a lot of marketers. Almost 40% of them believe that producing enticing infographics and similar visual forms of content is one of their largest challenges. And yet, considering how effective Instagram infographics are at conveying data and information — it’s absolutely necessary.

However, we’ll let you in on a little secret — it’s not that hard, you just have to learn how to do it properly. And yeah, that’s probably true for everything. But in this case, you’ll see that it’s more simple than you know.
What is an Infographic?
About a decade ago, infographics absolutely exploded into the graphic design mainstream. And in the meantime, they’ve become an absolute staple of the field. If you’ve sat through a tedious office seminar, attendant a class, or searched for statistics on a topic across the web — you’re bound to have come across one.
However, you might still be wondering — what are infographics in the first place? Don’t worry, our in-depth guide includes a quick crash course on infographic basics.
Now, it doesn’t take a Sherlock Holmes to deduce that the word “infographics” is a compound of — drum roll please — information graphics. And if you want a more textbook-ish, dictionary definition: these information graphics are visual representations of data and information.
Don’t worry, we won’t just leave you with that; it’s important for you to understand what infographics are in practice. And in that sense, they’re a collection of images and data visualisations, combined with minimal text, that gives viewers a basic overview of any given topic.
Those “data visualisations” are just a fancy name for bar graphs and pie charts — the bread and butter of social media infographics.
Of course, just having a bunch of visualised data isn’t enough — infographics are only effective when they’re made with engaging visuals that simultaneously draw the eye and communicate information efficiently.
But with that in mind, why are infographics so important for social media marketing?
Benefits of Infographics for Your Social Media Marketing Plan
In general, digital marketers use infographics in a variety of ways. You can include them in a landing page to quickly showcase the upsides and achievements of your business — or use them to make a newsletter more visually striking.
Infographics are a great way to collect quotes and testimonials in a more approachable format for website visitors — and they’re an excellent option for summarising the crucial points of an ebook, white paper, or any order lead magnet.
When it comes to social media specifically, stunning infographics can help you:
Widen Your Target Audience
In the world of social media today, most people that aren’t already interested in your niche or industry probably won’t read text-heavy articles and blog posts about your company. However, if you present them with a chance to see the gist of it in a social media post through clever use of infographics — they’ll be more receptive.
After all, we’re all visual learners — and infographics use that fact to help you reach people with various preferences and expand your general reach.
Put a New Twist on Your Content
Sure, an exciting trip, Christmas morning with your family, or an expensive dinner in a fancy restaurant are all nice things — but there’s nothing that brings more joy to a content marketer than effectively repurposing old content.
And once you learn how to make infographics, your old blog posts and articles will basically become an endless well of inspiration from which to draw on for new visual content. Take your text-heavy content, strip it down to its absolute core, and convert all the important points into smaller chunks of visual content.
Considering the fact that no one reads long Facebook and LinkedIn posts nowadays, this is the only way to reach a wide audience in an increasingly visual world of social media. A single blog post can be a series of infographics on platforms like Instagram or Pinterest.
Drive High-Quality Website Traffic
All of us love using social media to direct traffic back to our websites — that’s what it’s for, right? Sure, some people might say it’s for posting meaningful content from our lives and sharing it with friends and loved ones; but content marketers and business owners know the actual truth!
And if you want to drive high-quality traffic full of interested leads to your website — infographics are the way to go. After seeing thought-provoking information on your infographic, leads are far more likely to check out what you’re offering on your website — leading new prospects right into your sales funnel. In fact, some estimates show infographics improve website traffic by over 10 percent.
Increase Brand Authority
When your brand constantly publishes valuable, interesting data by sharing infographics, people start thinking — gasp — that you actually know what you’re talking about! And at the end of the day, that’s what we all want, right?
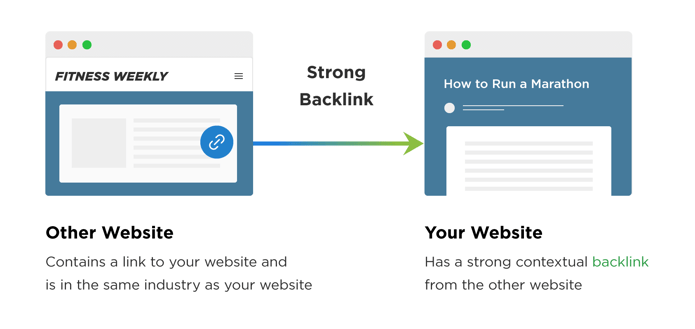
Share enough information that’s relevant to your target audience, and you’ll be seen as a reputable website; both by your target audience and (perhaps even more importantly) by Google’s SEO algorithms. Soon enough, other authoritative websites will start sharing your infographics — leading to more backlinks and even bigger authority because other industry leaders are vouching for you.
Become a Thought Leader
In the process of increasing your brand authority, you might even help people learn a thing or two along the way — and that can’t hurt, right? According to various studies, infographics and similar visual content is the most efficient medium for retaining and learning new information.
So, a marketing infographic will help you communicate your message effectively and keep it ingrained in your target audience’s minds — all while they learn more about your industry, services, and products.
Boost Your Social Media
We’ve saved the most obvious point for last — infographics give your social media followers something interesting to share with their social circles. This will result in a far more impactful social media presence for your brand.
Ideal Infographic Specs for Different Social Platforms
Okay, now that you know why infographics are so darn important, the question is — how do you actually design them?
Luckily, there are plenty of different online editing tools that can help you design effective infographics without much knowledge and experience in design. However, you still need to make sure that your visual content is suitable for the different platforms in practice.
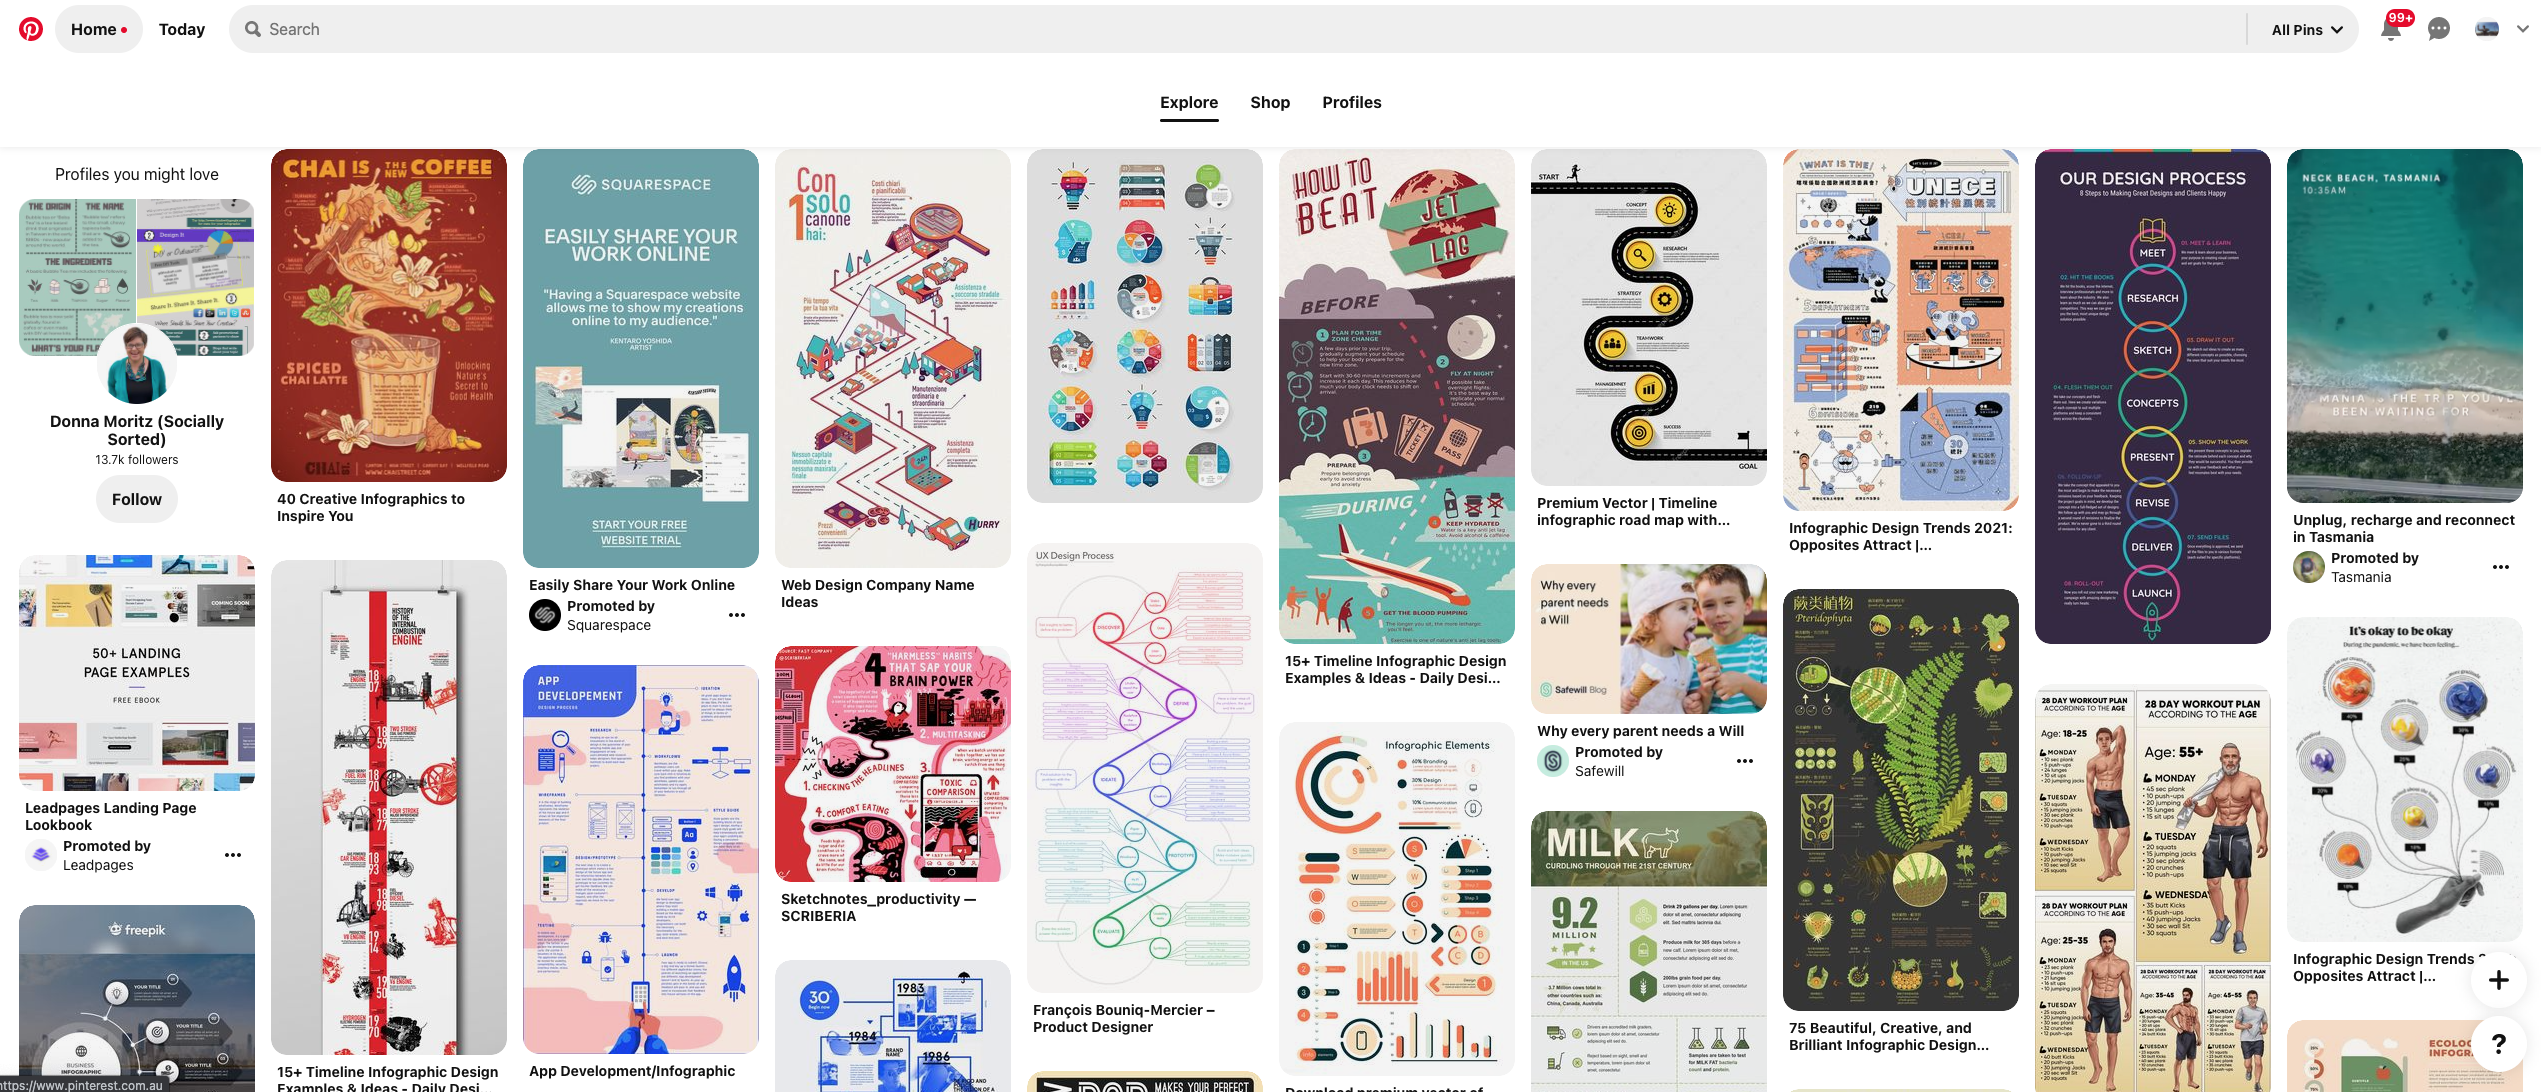
For instance, that’s not an issue on Pinterest — that network is compatible with most image sizes, and you probably won’t have to do any resizing for it.
 On the other hand, if you want your infographics to show up full-size on Twitter — remember that the image dimensions for that social network are much smaller: 440px by 220px. That’s why you need to limit the amount of content you want to include on a single image. You may want to go with an 880px by 440px canvas — allowing you to get a bigger surface area that’s still easily resizable for Twitter.
When it comes to Facebook, the accompanying images for blog posts and articles is 1200px by 620px. And don’t worry about further resizing — Facebook does it automatically to provide the best possible view to its users.
Finally, Instagram infographic dimensions go up to 1080px by 1080px. Depending on your specific infographic scheme, you can easily resize this to be 600px by 600px or 800px by 800px.
And now that you know what dimensions you need for different social media platforms, we’ll get into the nitty-gritty of picking the right message and data for your infographics.
Choosing the Right Message and Data
Okay, so the first rule of infographics is pretty logical — don’t go overboard with text. The emphasis is on visual content here, so there should be as little text as possible. If you want to make a deeper dive into the topic you’re presenting with the infographic, you can always use it to link viewers to a longer content form, like a blog post or a video.
There are a couple of short-form content types that infographics use to convey your message and data:
- Titles
- Facts
- Charts
- Inspirational quotes
Inspirational Quotes
Inspirational quotes are there to — shocker — inspire. Jokes aside, they perform best on platforms that are more prone to personal and lifestyle-oriented content: such as Instagram and Twitter.
Consistent use of inspirational quote infographics can result in sizeable boosts to your follower count and target audience engagement. And while they also convey the least and most superficial amount of data — inspirational quotes are also the easiest to create. You just need to make sure they’re minimalist, clean, and that they directly deliver a specific message.
Charts
These are also great at boosting engagement on pretty much every social platform, especially for B2B audiences. Depending on their topic, charts can be used to educate, inform, inspire, motivate — and even for jokes. Plus, they’re quite simple for sharing on both Facebook, Twitter, and Instagram.
Another advantage of charts is that you don’t have to be a data visualisation expert to create a decent one. These days, there are plenty of free graph maker tools you can use to create a pie chart in minutes — Canva has one built-in, for example.
Facts
Who doesn’t love reading a fun fact while sipping their morning coffee?
If you have a great idea for visualising a fact that’s relevant to your target audience, go for it — just make sure you’re using credible sources of information when you’re presenting something as fact, and not a subjective opinion. Government websites or reputable think-tanks like the Pew Research Center are always a great choice for objective references.
Titles
Finally, plenty of people like to combine their blog posts with infographics and similar visual content for maximum effect and visitor attraction. Instead of using text headers, you can use infographics to divide your written content and represent what each part of your article is about. Brand logos, symbols, icons, and similar visual elements are frequently used to make users aware of specific topics without resorting to an overwhelming amount of text.
Different Programs and Templates for Creating Infographics
As we’ve mentioned above, you don’t need to be proficient in data visualisation or graphic design to create stunning infographics for social media these days. There are plenty of tools that do most of the heavy lifting in the process, and we’ll showcase some of the most popular ones right here.
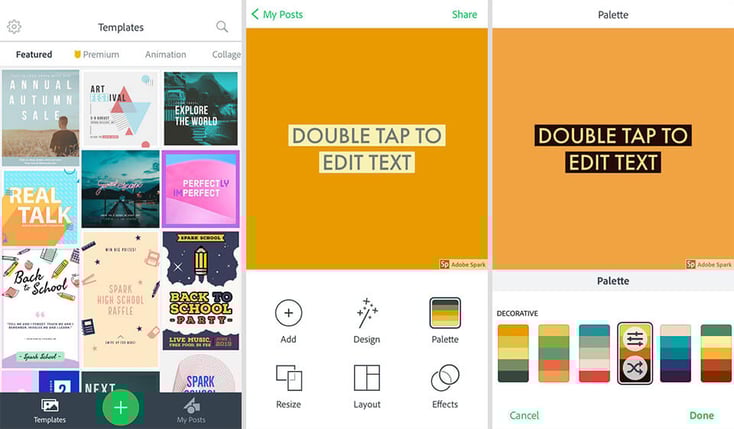
Adobe Spark
Most graphic designers use at least some of the various software offerings by Adobe. However, while the likes of Photoshop and Illustrator were made for professional graphic designers — Adobe Spark was specifically created for web page design, short videos, and social media posts. It’s a versatile piece of software for design that’s easier to pick up than most — and you can easily export the results of your work and email them to anyone, or start uploading them to social media right away.
It’s mainly used on mobile devices, so bear in mind that Android users only have access to the social media features here — while iOS users have access to the app’s full capabilities. There’s also a free trial version, and an individual plan will set you back $9.99 each month.
Canva
There’s no talking about online tools for creating infographics without discussing the most popular one: Canva. Its simplistic drag-and-drop interface for lightweight graphic design is second to none — and the platform also comes with countless infographic templates. That means you don’t have to spend hours designing every visual aspect of your infographic — you can focus on the data you want to use and the important elements, and just incorporate them into one of the hundreds of available templates.
Plus, Canva is incredibly versatile — meaning you can use it for pretty much any kind of design, such as social media posts and other marketing content. You can also use it to design everything from business cards and t-shirts to entire education lesson plans. In fact, you can pay Canva to print out your content on a t-shirt and ship it to you! The paid version of the platform comes with even more collaboration tools — it includes social media post scheduling, for example.
From a marketer’s perspective, the ability to design infographics and all other visual aspects of your digital marketing campaigns is a great boon — along with the ability to schedule and post your stuff on social media without leaving the Canva software ecosystem.
The professional version plans have different tiers, with the cheapest one being $12.95 per month.
Easel.ly
Easily is — all pun intended — the operative word here, as this platform boasts being the easiest and simplest way to create an enticing infographic. They have tons of useful templates that can be edited to fit your needs — they have a library filled with useful images, though you can obviously upload your own as well.
The important thing here is that you don’t need to do a lot of work yourself. There’s even an Easelly design service, providing you with custom-made templates for your content for a small fee. It’s quite affordable, and the business tier package has group use and real-time collaboration features.
Easel.ly is definitely the most affordable tool for creating infographics on this list, as the professional version for businesses costs just five bucks. Individuals pay $4, and students can access it for a low price of $2.


 1300 71 61 41